Tuesday, August 7, 2012

How did we find out about the Cleveland County, OK fire?

The eastern Cleveland County fire last weekend was a big wakeup call for me about the most understated threat to our house and wellbeing.  I honestly wasn't thinking much about fire danger for the previous days prior to the fire.  But perhaps I should've been a bit more aware in the same way that we are for the more traditional severe weather around here.  After all, there were last year's fires to remember and the resurgent drought that really accelerated the drying of our trees within the last two weeks. As a note, Daphne was more aware than I considering the drought and the days fire danger. 

This fire day shouldn't have been surprise at all, just a disappointment that it was human-caused despite the forecasts.  First, the SPC highlighted the equivalent of a high risk in fire outlooks when they outlined central OK in a critical risk outlook.  The local NWS office hit us hard with a fire weather watch the previous day and then a red flag fire warning from the early morning.  The wording doesn't get stronger than what you see below.


The Storm Prediction Center's day 2 fire outlook for 2012-August-03. See that critical area that outlooked Oklahoma.  Subsequent forecasts didn't change.

The NWS Norman's red flag fire warning for 2012 August 03 issued early that morning.  The wording says, don't do anything that can start a fire!

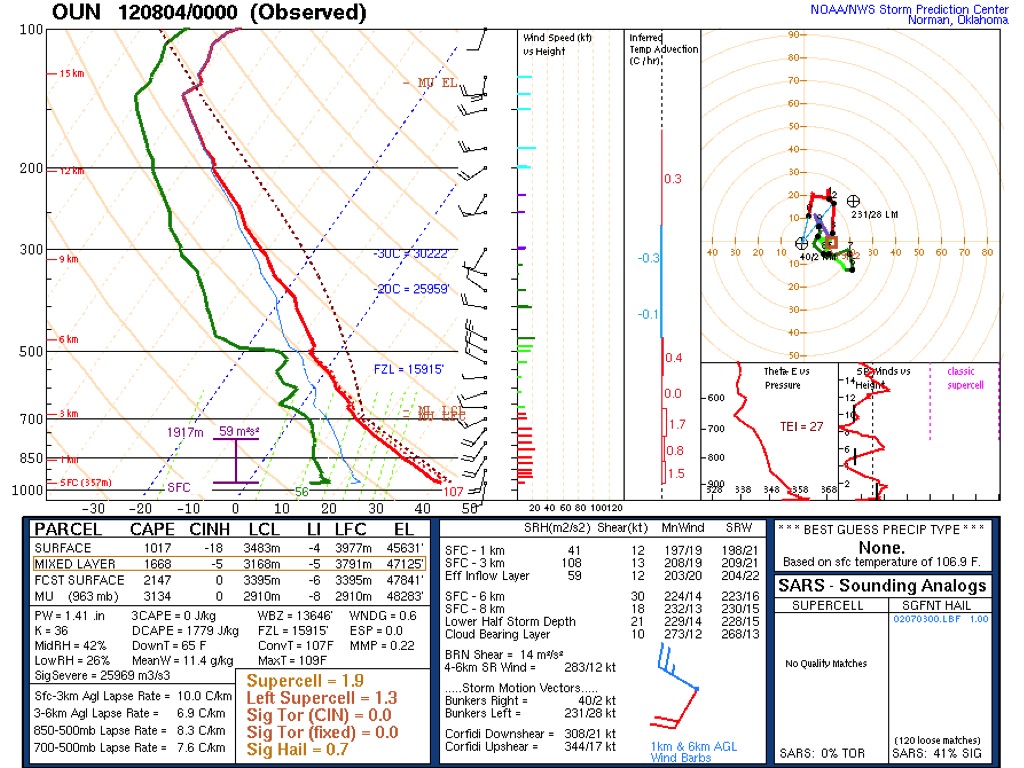
Later that day, I could've simply looked up a couple popular fire weather indices to see that both were maxed out as high as possible.  Both the Low altitude Haines index  or the Atmospheric Severity Index for fires combine the temperature lapse rate aloft with available moisture.  When the lapse rate is high and the moisture low both of these indices go up.  But I didn't need to look at an index to tell me what I could plainly see from the morning sounding, the strong southwesterly winds, near all-time record high temperatures, low humidity and nearly dormant vegetation (and I mean trees!).  The day was going to be pretty volatile.
The low altitude Haines index map from 2012-August-03 18 UTC.   Available from http://www.spc.noaa.gov/exper/mesoanalysis/

The Atmospheric Severity index from 2012-August-03 20 UTC.  Available from http://www.spc.noaa.gov/exper/mesoanalysis/
 Clearly with such volatility in the forecast, we had perhaps two days to be set for a quick evacuation should a fire arise.  That amount of lead time could've allowed us to be in the SET to GO stages of the ascending level of readiness (Ready, Set, Go) in this website http://www.readyforwildfire.org/defensible_space.  We had been working on the 'Ready' part for some time.  For instance we had installed a metal roof, cleared the woods of low brush southwest of our house and cleared out some Cedar trees near the house.  But the SET to GO stages wasn't something in our minds until the evening of the 3rd when the huge wildfire erupted to several miles to our southeast.

When the fire started at noon, I wasn't thinking much of evacuation.  I was at work involved in another project while Daphne was involved with hers.  But after a few hours, and after several co-workers suggested that I look east, I decided to do so.  What I saw was quite amazing because I never saw a fire of this intensity.  The time lapse here shows more than enough to get the idea.  I drove home and by 7 pm it was apparent that evacuation might be necessary as winds started to back toward the southeast, the direction of the fire.  Now we were in a personalized warning response mode.  However we were still trapped in that mode of needing confirmation and wanting just a bit more information.

We had many sources of information.  After some days of reflection, I compiled sources of information that we used to help us with deciding whether or not to go.  I list some here with my opinions on how useful they were.

At first we heard about the local emergency management requesting NWS Norman to issue a fire warning.  This was serious.  The EMs don't typically ask for this unless they feel the fire is out of control and headed for people.  The Friday fire met those conditions and the NWS complied.  The locations were quite specific and well southeast of our house.  Because of this, we took note but thought the fire was not an imminent threat to us.  We did have friends living much more closely to the warning than we and we chatted on Facebook about the threat.


Second on the docket was the Fire Detection Map that Daphne found out about from a friend of ours (Mike Splitt).  We looked at it and used the MODIS imagery to show the current location of the fires.  Despite the imagery being slow to load, we were able to view a map much like the one below but at an earlier state (most of these fires were much smaller or nonexistent yet).  The map was well made but the problem was update frequency.  Depending on MODIS just doesn't cut it when we wanted frequent updates.  I could get more information just by looking outside and watching the plume.


The fire detection map from the Federal govt showing the aerial extent of Oklahoma fires based on MODIS satellite imagery on 2012 August 06.
Another useful product that we viewed was the short-term forecasts published by the NWS Norman.  For example on Friday evening, they expected a cold front to slide across us.  Their timing for the front's arrival was about 9 pm.  We expected northerly winds after the front would push the fire back onto itself - a good thing.  We later learned that this pushback wouldn't necessarily be that good because houses previously saved would be under threat again as the fire may burn previously unburnt vegetation.  However at the time, our theme was the front would halt the northward progression of the fire.  Our friends were much more desperate as their house was in the path of the fire and the front would save their house only if it arrived in time.  As it turned out the fire got to their latitude first and it was the huge firefighting effort that saved their neighborhood.  The forecast was a little generous in its timing when the front slowed down by a couple hours.

A graphical forecast of frontal positions issued by the NWS Norman during the late afternoon on August 3.
One of the most useful items I found was the real-time radar reflectivity overlaid on a high-resolution map on my phone.  This little app was created by a student at OU (Ross Kimes) that allowed me to track the location of the fire plume every 5 minutes.  I could tell immediately how vigorous the plume was.  As the evening progressed, the plume narrowed and became less vigorous as the fire began to 'lay down' for the night.  Make no mistake that the winds ahead of the front were still strong and the temperature was at record levels for the hour.  This fire was still a big danger but at least there was some hope that neighborhoods wouldn't be consumed as long as the firefighters were actively fighting.

The radar was a great tool as long as it could detect the plume.  But by 11 pm the plume all but disappeared as the fire weakened.  Now while the weakened plume indicated the fire was less active, it was still burning and moving.  But by then the radar was useless.


I have to admit I look at Facebook quite frequently but perhaps I was almost obsessed with it this evening.  Daphne and I weren't capable of looking at everything but with our friends posting constantly, we found out about information sources we couldn't have otherwise.  I commend Peter Laws, Shannon Keys and Tim Vasquez for finding out stuff that I didn't know existed.  Peter's great at tracking down radio frequencies while Tim and Shannon are internet mavens.  We offered some useful info too and between us, we were much greater than as individuals.  It was this information channel in which we heard that the firefighters thought that 108th Ave. might be at risk as the winds backed in the evening.  Consequently, our thoughts of evacuation  accelerated.  We also heard from Peter that police were coming to our neighborhood door to door to encourage us to evacuate.


One of the more interesting sites that Peter shared was an on-the-fly, and totally grass-roots, map-based fire map produced by Shane Young and Bob Fritchie.  They actually independently started logging emergency radio reports and then found out about each other.  After combining resources, an incredibly detailed map of radio reports emerged to become available on Google Maps for everyone to view.  There isn't a name for it as far as I know so for lack of a better one, it's the Cleveland County Fire Map.  Now I could visually see what I could previously infer from radar - the extent of the burn area.  Shane and Bob updated other interesting tidbits including evacuation zones, helicopter water sources, and firefighting activities.  They even wrote down what the firefighters thought of the fire behavior.  Simply put this is an amazing labor of love with an amazingly useful dimension.  We used this to watch as Tim and Shannon's neighborhood was literally being surrounded by fire.
The Cleveland County Fire Map as of 2012-August-06 at 2300 UTC.
Perhaps the only more useful information sources than the Cleveland County Fire Map was to hear directly from the source.  I had installed a phone app called "Emergency Radio" that allowed me a drop onto the Cleveland County Fire frequencies.  There was no better real-time source of information since I heard everything the fire fighters and incident command said with perhaps only a 30 sec delay through the internet.  Daphne also accessed the same source through an online site like radio reference.    With the app both of us had it on continuously from Friday afternoon through today.  I had it on when we were evacuees residing Greg Stumpf's place, or at the park or Jimmy's Egg.  It was like listening to a drama except this was real and anything that was said was absolutely critical information.

Having said all the positive things about live radio feeds is that sometimes it's too easy to lose the awareness of the forest amongst the proverbial trees.  The firefighters were understandably extremely terse with their communication and there were times it was hard to figure out the big picture, especially after being away from it for awhile.  That's why the Cleveland County Fire Map was so useful.  It brought back some context.

Finally, what got us out the door was the friendly visit by the Norman PD as they went door-to-door Friday night near midnight.  We were already packed and waiting for a trigger.  Given the possibility that the fire might threaten 108th Ave., our escape route, we decided to go.  Our decision was aided by friends offering up to stay at their places (thanks to Mansel's, Greg Stumpf, Mark Sessing, and a few others for their offers).  We wound up staying overnight at Greg's place, along with the cats etc.

Of course we used more traditional sources of information such as the phone.  But to be honest, we didn't use that as much as I could imagine a decade ago. 

Finally as an epilogue, there are some notable information sources that I don't have here and wound up disappointing.  First of all, the TV media was great at showing dramatic footage from their helicopters.  But I was disappointed by their lack of information about the fire location and evacuation statuses.  They could've easily tapped into the radio frequencies, stringers and reporters to generate a map too.  But I didn't see one and the gap was filled by two people with no budget, only motivation (power of the internet).  Apparently Shane and Bob also found the TV media somewhat disappointing.  Twitter was also disappointment.  Yes there are the #okwx and #okfire hashtags.  But they were filled by people understandably concerned with the welfare of relatives and friends.  And sometimes there were just redundant retweets.  The only updates to the fire came from the NWS, and that was only to update watches and warnings - a temporal frequency well short of what we needed.  Finally, there was no official government avenue of information of which we were aware that could've told us when evacuation areas would be reopened.  I think the local government needs to get on Twitter or some kind of messaging service so that displaced people can find out these things. Perhaps their information was channeled into a more traditional line of communication like broadcast radio.
Now, that's not to say that we could've done better.  After all perhaps we needed to turn on old-fashioned radio and select a good station.  Perhaps local stations were getting all of the official information on fire locations and evacuation updates.  For a local event like this, radio doesn't have the edge.  But if power started going out and the emergency grew in size, the first loss of communication modes will inevitably be the more advanced ones like 3 or 4G and wireless.  Radio's still the backup, whether it's direct access to emergency bands through a scanner or radio stations.  I still have to remember that.

Saturday, August 4, 2012

Oklahoma fires of August 2012


The summer of 2011 was bad for Oklahoma but the summer of 2012 is rapidly catching up.  In fact the fires of August 3 were more intense than anything I've seen in 2011.  Yesterday a fire blew up on the east side of Slaughterville, OK around noon and quickly grew as it spread north along 120th SE. Ave.  When I came out to see the fire, it sported one large pyrocumulus on top of a plume-like updraft reminiscent of the east Noble fire in 2011 September 03.  The only difference is that this fire looked much more likely to be a candidate for a firestorm considering the much stronger plume-like updraft.  
A picture of the east Norman wildfire on 2012 August 03 1620 CST (2220 UTC).  The fire plume is about 13 mi east of my location at the National Weather Center.

With a plume like that, it's no surprise that it showed up on radar.  For much of the day the fire appeared as an oval of 25-40 dBZ echoes much like viewed below.  On satellite the plume exploded in the late afternoon as it spread mostly east.  Curiously there was a small appendage that formed and peeled off to the southeast.  
On the left, a base reflectivity image from the Twin Lakes radar  at 2228 UTC showing the reflectivity echo associated with the smoke and ash plume of the east Norman fire.  On the right is the closest GOES visible satellite image of the fire within the circle.  Other fires were burning near Chickasha tot he west and up by Mannford, OK in northeastern OK.
 That small appendage to the southeast shows up very well in the time lapse I made of the event from 2146 - 2310 UTC.  About 10 seconds into the video, the fire must've fed off some especially rich fuel sources that pumped a much stronger updraft into the air and raised the equilibrium level that much higher.  Check it out below.


At the end of the video you may have seen a balloon launch from the small shack in the lower right part of the time lapse.  This launch shows up in the sounding SKEWT chart below.  The first thing of interest about the sounding is the exceptionally deep layer of steep lapse rates rising up to at least 5 km. Surface temperatures were exceptionally hot at near 110 deg F.  Looking at the winds helps explain that southeastward pulse in the cloud when the strong updraft pulses took off and then encountered a layer of northwesterly winds at the 500 mb level.  So this pyrocumulus cloud appeared to be quite high.  In fact, I used the Theodolite app in my phone to measure the height of the cloud.  I estimated that the plume was about 13 mi to my east which is how far 120 th to 132nd Ave is to the east.  I got a cloud top height of 5.4 mi or around 8.6 km above the ground.  With that information I could overlay the first picture in this blog on top of the sounding from the National Weather Center and it shows clearly that the cloud reached well into the northwesterly winds in the sounding.  Also at that elevation the cloud should've been nearly -20 deg C!  Wait, that's cold enough for significant glaciation.  Yet the time lapse didn't show the top turning to ice.   But it was close I'm sure.  A couple hours later, I heard that Tim Vasquez, just south of Lake Thunderbird and northeast of the fire, reported rain!   I heard other reports of rain too in that area.  So this pyrocumulus was quite close to turning into a pyrocumulonimbus!


A SKEWT plot of the Norman, OK sounding from 2012 August 04, 00 UTC.  The balloon was actually launched around 2304 UTC.  

The Norman sounding from above was overlaid on the picture I shot at about time the fire produced the maximum cloud top height around 2220 UTC.  I matched the height of 8.6 km to roughly the same position in the sounding.  
At the end of the time lapse the plume weakened somewhat as the fire began to feel the effects of a cooling boundary layer.  I drove eastward to my house (uncomfortably close to the fire) and by then the fire was producing mostly a wind-driven plume with a much lower maximum height.  It was still producing pyrocumulus then but not nearly with the vertical extent as before.  By night, the fire was purely a wind-driven plume as the nocturnal picture below shows.  By the way at nightfall I was smelling smoke even though the main plume was to the east.
A picture of the east Norman fire from Post Oak and east of 108th Ave. SE around 2320 UTC.


A picture of the east Norman fire plume seen just above the trees taken from the west side of Lake Thunderbird at 2056 UTC or 2012 August 04, 0256 UTC.  The eerie orange glow was fortunately located far enough southeast of us but still we were suggested to evacuate shortly thereafter.  
The fire behavior that I've seen on this day has exceeded anything I've experienced in central Oklahoma.  I've seen pyrocumulus the previous year but nothing compared to this.  Certainly I've not heard of a fire producing a rain shower such as this one did.  Perhaps I shouldn't be too surprised that we're passing into new territory.  The temperatures over the past week have also exceeded anything I remember before.  In the previous two days the temperatures have reached above 110 deg F.  The Norman mesonet site has breached 113 deg F.  That's tying the all-time record max temperature at the Oklahoma City airport.  Then on this day the airport itself tied its all-time high temperature record.  What's more, this day was the hottest day ever because the morning maximum low temperatures were hotter than ever before.  Some areas couldn't get below the upper 80's F!
Maximum temperatures from the Oklahoma mesonet sites on 2012 August 02.

A surface plot on 2012 August 12 at 22 UTC with the area in orange exceeding 110 deg F.

Maximum temperature record tied at Oklahoma City on 2012 August 03.

With these unprecedented temperatures, the burn index was higher than I've seen last year.  The 10 hour dead fuel moisture was exceptionally low.  Any other fire index that has been made also showed unusually favorable values around here.

Two fire parameters produced by the Oklahoma Climate Survey, the burning index above and the 10 hour dead fuel moisture below for 23 UTC 2012 August 03.

Another aspect of these fires that I've never seen before is that we've now finished the second day of this fire with little hope that it'll be contained before sunrise.  Seeing two days of active fire is unusual to say the least.  Unfortunately that means the fire has consumed a large amount of terrain and many residents have become victims to its persistence.  I know of several friends that still don't know the fate of their houses.  Now the fire has entered into the Clear Bay area of Lake Thunderbird and also is spreading toward Little Axe.

A real-time fire map made available based on reports received from the Cleveland County fire authorities.
And finally, this fire is nowhere near the size of the one east of Mannsford, OK.  That fire has exploded today with a 10 mi long front and a plume that has actually created cumulonimbi, and quite likely thunderstorms, as the atmosphere has destabilized ahead of a cold front.  This fire has possibly reached 40,000 acres in size.
The composite reflectivity image from the KINX radar at 2012 August 04 2152 UTC showing nearly 50 dBZ echoes downstream of the Mannford, OK fire.  The corresponding GOES visible image showed cumulonimbi embedded within the fire plume.  Other high-based cumulonimbi started to initiate along the front to the north.


Friday, May 11, 2012

The nonsupercell tornado outbreak of 2012 May 09 along the Gulf Coast

One or two reported waterspouts in a day along the Gulf Coast is a fairly common occurrence during the warm season.  But to see two reports of multiple simultaneously occurring waterspouts is quite unusual.  That's what happened on May 9 when reports started to come in of six waterspouts southwest to southeast of Bayou La Batre, AL around 1145 CDT, and then two more waterspouts were reported northwest of Grand-Isle, LA by 1430 CDT (figure 1).  The two by Grand Isle apparently passed across the island together according to Tim Osborne, a NOAA employee.  


Figure 1.  A map showing the location of the waterspouts near Bayou La Batre, AL (upper right) and Grand Isle, LA (lower left).  The picture fro Grand Isle was taken by Capt. Danny Wray and the Bayou La Batre image was taken off a Twitter feed @tbJowers.


A news story from FOX10tv.com caught my attention mainly because they classified these vortices as 'fair-weather waterspouts', especially referring to the waterspouts by Bayou La Batre.  See this quote "FOX10 News Meteorologist Michael White says these waterspouts are considered non-tornadic, or fair weather".  Really, nontornadic?  They got their terminology from the National Ocean Service, a NOAA site.  So I went to their site with the term "fair-weather waterspout" and I found this.


Fair weather waterspouts usually form along the dark flat base of a line of developing cumulus clouds. This type of waterspout is generally not associated with thunderstorms.
Okay, they determined that fair-weather waterspouts are nontornadic because they are not associated with thunderstorms.  Perhaps on the surface that may seem okay since the definition of a tornado is a violently rotating column of air in contact with the surface and pendant from a cumuliform cloud (see AMS, 2012).  Oh wait, the definition didn't specifically say 'thunderstorm' but instead a cumuliform cloud.  But I'll let that flaw ride for now and discuss whether or not these vortices came from cumulonimbus clouds. These clouds represent deep, moist convection, the most common cloud associated with thunderstorms. Although the presence of lightning is not a necessary condition for defining a cumulonimbus.  Some cumulonimbus updrafts are too weak to split enough electric charge to generate lightning.  


So is FOX10tv correct in saying the waterspouts offshore of Bayou La Batre were nontornadic, pendant from cumulus clouds?  To test this idea, I show you the radar data from Mobile (figure 2).  I'm to assume that cumulus clouds should not generate heavy precipitation (>40 dBZ) and certainly not lightning.


Figure 2.  A four panel radar image of the area in the vicinity of the waterspouts offshore of Bayou La Batre from 1640 to 1649 UTC.  The waterspouts occurred around 1645 UTC.  The top left panel represents the lowest scan reflectivity from KMOB.  The top right panel shows base velocity at the lowest scan.  The lower left panel shows the maximum expected hail size (blues are > 0.25", yellow is > 0.75"), The lower right panel shows spectrum width of velocity.  Sometimes isolated peaks in spectrum width may indicate the presence of a unresolved vortex.
Clearly this loop shows a line of very heavy convective rain showers developing along an axis that most certainly spans the region where the waterspouts formed.  The maximum expected hail size panel (MEHS) indicates that these heavy precipitation cores extend upward into subfreezing temperatures and that the inferred presence of hail indicates an inferred presence of lightning.  Lightning was reported as a matter of fact west of KJKA around 1645 UTC.  The visual manifestations of one of the precipitation cores can certainly be seen left of the waterspouts in the photograph in figure 3.


Figure 3.  A photograph of four waterspouts offshore of Bayou La Batre, AL somewhere around 1645 UTC.  This picture was taken from the twitter feed @tbJowers.


These waterspouts were certainly pendant from a cumulonimbus cloud actively generating lightning - hardly fair weather.  Judging by the considerable spray lofted by some of these vortices, they're certainly intense, enough to pose danger to small craft that may wander too close.  These are tornadoes.


What about the vortices that crossed Grand Isle, LA?  A larger view of the picture in figure 1 shows two vortices made visible by well defined funnels (figure 4).  Each one was embedded in a somewhat larger circulation manifesting themselves as collars.  They're both adjacent to a pretty dense precipitation core.  In fact the vortices appear to be embedded along an outflow boundary forming from the precipitation.  


Figure 4.  Photograph of the Grand Isle tornadoes somewhere near 1930 UTC.  This picture was taken from the southeast of the tornadoes by Tim Osborne of the New Orleans National Weather Service.


The nearest NWS Doppler radar to these vortices shows a developing thunderstorm northwest of Grand Isle with heavy precipitation (figure 5).  The location and timing of these vortices is much more precise allowing for a more direct comparison to the features viewed by the radar. Two notable features include two specific bulls eyes of high spectrum width at 1931 UTC just to the northwest of Grand Isle.  The vortices are quite likely colocated with these spectrum width bulls eyes.  Both of these local peaks also happen to be located along a convergence zone that is likely marking the onset of the outflow boundary.  The maximum expected hail size shows values somewhere between 0.25 and 0.5" and that indicates heavy precipitation extends high enough into the atmosphere that this storm is a cumulonimbus cloud, and quite likely an active thunderstorm.  Clearly these vortices are tornadoes too, and one of them blew the roof off of a house.

Figure 5.  Same as figure 2 except for the Grand Isle, LA thunderstorm viewed by the KLIX Doppler radar.  
Having settled comfortably with the idea that both of these events were tornadic, what kind were they?  That could be a difficult question to answer since the atmosphere is a complex dynamic system with many soft boundaries between phenomena of one type or another.  Nevertheless in the world of classifying tornadoes we like to associate them with common mechanisms involved in their formation.  


The most common involves the tilting of horizontal vorticity into the vertical through a complex interaction updraft and downdraft within a supercell.  The implication is that a mesocyclone is typically present through a deep layer starting below 2000' above ground and should be detectable by Doppler radar.  Supercells also exhibit significant hook echoes, inflow notches in the radar reflectivity, long-lived strong echoes overhanging the low-level notches much like the conceptual model in figure 6.

None of these storms had any detectable mesocyclones aloft during the tornadoes (figs 4 and 5).  Nor did the storms exhibit any of the reflectivity-based signatures of supercells.  That is not to say that some of these processes were entirely absent on this day.  After all, there was actually some vertical wind shear on this day, perhaps not quite enough to strongly suggest supercell environments with low-level mesocyclones.


Figure 6.  A conceptual model of a supercell as viewed by S-band radar.  The cloud boundaries were superimposed on the reflectivity as well as areas of cold pool (blue shading) and large scale wind flow (broad arrows).  


Another common tornado production method involves superimposing a developing thunderstorm on top of a pool or axis of air with a lot of low-level vorticity.  The thunderstorm updraft then stretches that vorticity into a tornado as the conceptual model in figure 7 shows.
Right away there is some merit to this model.  Both sets of tornadoes formed as the thunderstorms were forming.  Supercell induced tornadoes typically occur only during the storm's mature phase.  

Figure 7.  A conceptual model of nonmesocyclonic tornado formation.  Low-level strong horizontal shear rolls up into small circulations that could grow into tornadoes should a deep convective updraft pass overhead.
Figure 8.  A surface map from 2012 May 09, 1643 UTC with a cold front analyzed with the blue curved line.  The tornadoes at Bayou La Batre occurred just after this plot while the Grand Isle tornadoes occurred 90 minutes later.
But the question is, was there a pool of strong horizontal wind shear available before storm formation?  The surface plot in figure 8 suggests that was possible.  Both areas of tornado formation occurred in close proximity to a weak cold front.  Winds across the front showed adequate convergence and some indication of horizontal shear.  In fact, an analysis of vertical vorticity showed areas of high values in the vicinity of Bayou La Batre and Grand Isle.  Both of these areas exhibited high values of CAPE (Convective Available Potential Energy) in the 0-3 km layer (figure 9).  These high values of low-level CAPE are important indicators of good low-level buoyancy for which allows convective updrafts to quickly pull up and stretch the low-level horizontal shear.  Whether or not there were pre-existing circulations on the front is one question I cannot answer given the lack of a nearby radar.  But at least the background ingredients appeared to be favorable for nonmesocyclonic tornadoes.  This environment was similar to that found in many studies (e.g., Brady and Szoke, 1989; Wakimoto and Wilson, 1989).  That we had not one but a small outbreak of simultaneous tornadoes plays very well with the concept of a boundary with strong horizontal shear rolling up into separate small circulations (called misocyclones) then stretched into tornadoes as Lee and Wilhelmson, 1997 demonstrated in a two part publication.    Figure 10 shows a three-dimensional visualization of their numerical simulation of nonmesocyclonic tornadogenesis.


Figure 9.  An analysis of near surface vertical vorticity (blue contours), instability in the low-levels (0-3 km CAPE red contours) and low-level winds (blue barbs) on 2012 May 09 17 UTC.  The star indicates the location of the Bayou La Batre tornadoes.

Figure 10.  A numerical model visualization of vortex sheet rollup leading to multiple nonmesocyclonic tornadoes from Lee and Wilhelmson, 1997 part II.


Once an environment is quite favorable for generating tornadoes, we often see more than one simultaneously.  This is true whether or not the origin of vorticity in a tornado draws from strong enough pre-storm horizontal or vertical wind shear.  Here are some examples of simultaneous tornadoes coming from supercells as a result of strong vertical shear (14 April 2012 near Cherokee, OK,  far back in 10 May 1991 near Lazbuddie, TX13 March 1990 Hesston-Goessel, KS tornado merger, 07 November 2011 Tipton, OK cyclonic-anticyclonic tornado pair). Simultaneous multiple tornadoes originating from sheets of strong horizontal shear appear in multiple links such as from oil platforms in the Gulf of Mexico (here), and off the coast of Australia (here).

Now that we established that the two outbreaks of tornadoes were likely nonmesocyclonic (nonsupercell) in nature, why do I not call them waterspouts over water and tornadoes over land?  Simply because the nature of the underlying surface has no immediate impact on how the vortices formed. Perhaps there is a secondary role in the form of a smoother surface allowing the vortices to intensify.  But that doesn't prevent the same mechanism from producing nonmesocyclonic tornadoes on land.  After all, land has a huge variety of smoothness. But if we see one of these tornadoes over forest vs prairie, we still call them tornadoes and not prairie-spouts or forest-spouts.  There is the term landspout that was unfortunately coined to describe a nonmesocyclonic tornado.  I say unfortunately because it served to obscure the fact that now we have two names to identify the same kind of tornado.  In fact, we have three:  landspout, nonsupercell tornado, nonmesocyclonic tornado.  Incidentially the visualization in figure 10 came from an overland simulation with a generic surface because technically the authors weren't concerned about whether it was water or not.    So, please, if an intense vortex forms from a cumulonimbus cloud, call it a tornado whether or not it's over land or water!


I mentioned before about returning to the distinction between fair weather vs tornadic waterspout.  I noticed a waterspout informational page from the National Ocean Service describing the differences in vortex formation between so called fair weather waterspouts and tornadic waterspouts.  The quote is below:

Fair weather waterspouts usually form along the dark flat base of a line of developing cumulus clouds. This type of waterspout is generally not associated with thunderstorms. While tornadic waterspouts develop downward in a thunderstorm, a fair weather waterspout develops on the surface of the water and works its way upward. By the time the funnel is visible, a fair weather waterspout is near maturity. Fair weather waterspouts form in light wind conditions so they normally move very little.
This statement is misleading in one way and incorrect in another.  

First there is the misleading part.  There is nothing in the glossary of meteorology that defines a fair weather waterspout.  According to the definition of a waterspout in AMS 2012, it is a tornado over water and a tornado can be pendant from any cumuliform cloud.   But given those conditions, what would prevent me from identifying that tornado?  It would be the strength of the vortex.  If a vortex strengthens enough to generate at least EF0 winds  and is connected to a cumulus, or cumulonimbus cloud, it is a tornado no matter what kind of surface lies underneath! If a boater sees a vortex lofting spray consider it a tornado.
Second, there is the incorrect statement that fair weather waterspouts develop from the bottom up and tornadic waterspouts build downward. The reality is nonmesocyclonic tornadoes develop upward from the near surface more often than not (e.g., Brady and Szoke, 1989; Wakimoto and Wilson, 1989).  That means both the Bayou La Batre and Grand Isle tornadic events likely developed from the near surface upward.  In fact 50% of mesocyclonic or supercell tornadoes develop upward with time as Trapp et al. 1999 showed.  More recent analysis from VORTEX2 shows that upward growth of mesocyclonic tornadoes may be more common than earlier thought.  


Addendum


I resident of Grand Isle just shared an incredible video of the tornado as it approached the island and then actually hit their house while the video was rolling.  


References

AMS, 2012: Glossary of meteorology. Available online at [http://amsglossary.allenpress.com/glossary/search?id=tornado1]Brady, R. H., and E. J. Szoke, 1989: A case study of non-mesocyclone tornado development in northeast Colorado: Similarities to waterspout formation. Mon. Wea. Rev.,117, 843–856.


Lee, Bruce D., Robert B. Wilhelmson, 1997: The Numerical Simulation of Non-Supercell Tornadogenesis. Part I: Initiation and Evolution of Pretornadic Misocyclone Circulations along a Dry Outflow Boundary. J. Atmos. Sci., 54, 32–60.
          
_____, Robert B. Wilhelmson, 1997: The Numerical Simulation of Nonsupercell Tornadogenesis. Part II: Evolution of a Family of Tornadoes along a Weak Outflow Boundary. J. Atmos. Sci., 54, 2387–2415.      
    
Trapp, R. J., E. D. Mitchell, G. A. Tipton, D. W. Effertz, A. I. Watson, D. L. Andra, M. A. Magsig, 1999: Descending and Nondescending Tornadic Vortex Signatures Detected by WSR-88Ds. Wea. Forecasting, 14, 625–639.          


Wakimoto, R., and J. W. Wilson, 1989: Non-supercell tornadoes. Mon. Wea. Rev.,117, 1113–1140.  

Wednesday, April 11, 2012

Prolific hail producing supercell in the TX Panhandle

Slow moving supercells are common in the high plains of North America where low-level winds oppose midlevel winds to result in slow storm motion.  This was no exception on 2012 April 11 when a supercell formed on a stationary front just north of Amarillo.  The supercell dropped huge amounts of marginally severe sized hail (~1") on Rt 287 south of Dumas, TX.  In fact, Rt 287 had to be shut down because drifts of hail covered the road several feet thick.  See the news story from MyHighPlains.com.  The hail accumulated from the large amounts of runoff as you can see from this flow of hail slurry near the highway.


This storm survived from near 3 pm CDT all the way to 8 pm as it crawled ever so slowly to the east toward Fritch, TX and then northeast toward Borger.  At no time was the mesocyclone very strong and so only one tornado warning was issued east of Fritch.  Instead the huge amounts of hail and heavy rain proved to be the main impact and then only on Rt 287, Fritch and perhaps Borger.  I can only imagine if this happened in a big city.

What made this storm so prolific in rain and hail was certainly adequate moisture.  In fact precipitable water values were 3 standard deviations above the norm for this time of year.

But perhaps more importantly, it was the slow storm motion and its relatively efficient precipitation production.  The storm motion was so slow because the low-level easterly upslope nearly opposed the midlevel westerly flow.  


This led to a hodograph that was capable of producing a supercell motion that would actually travel westward at only 3 - 5 m/s.  In actuality the storm moved to the east at roughly the same speed.


The other aspect was the prolific production of hail and rain.  Why didn't this storm produce much larger but fewer hailstones?  I'm not sure there's a clean answer but there are some possibilities.  One of them could be that the vertical shear was not quite strong enough to effectively reduce precipitation recycling into the main updraft.  Another possibility was that the main supercell periodically merged with ordinary cells initiating on its flanking line or the warm front.  One of these cells can be seen in this reflectivity cross-section facing west.  Repeated injections of hydrometeors into the main supercell could easily have boosted precipitation efficiency.


The result was a track of excessive hail and rainfall that lasted nearly 6 hours but only traveled a short distance.  The storm total precipitation produce from the Amarillo WSR-88D shows the track very well.  The maximum precipitation estimates reached 10" near Fritch!  However hail contamination likely led to an overestimate.  Even so, it's still a spectacular amount of rain.


Could the prolific hail production be detected in this storm that could've initiated a warning about significant hail accumulation?  I'll look into that in a separate post.  Since the radar at Amarillo was dual polarized recently, we may see some signatures pointing to such a possibility.

Friday, March 2, 2012

How does the West Liberty, KY tornado compare with other big tornadoes?

Today, a tremendous tornado outbreak from Indiana south to Alabama produced a spectacularly intense tornadic supercell in eastern Kentucky, of all places.  The tornado struck the town of West Liberty causing devastating damage and unfortunately there were many casualties.  The intensity of the damage and the size of the storm's circulation impressed me enough that I became interested to see how it compared to other spectacularly big tornadoes in recent history that I either seen, surveyed or know about in general.  So this post will be a tour of my hand selected big events.

I picked a single image from each event where the tornado just reached maturity and appeared to be near maximum intensity based on the lowest scan velocity from the nearest WSR-88D.  For the West Liberty, KY storm, that time occurred when the tornado was well west of the town where the tornado was still well embedded in its large parent circulation (figure 1).  The Jackson, KY radar showed what almost seemed like two channels of inflow feeding the tornado.  The appearance is somewhat an artifact because the radar was only detecting radial winds, and not the full two-dimensional wind field.  However, even considering that, I believe there were still two channels of enhanced inflow, one coming from the forward flank core in the form of the storm's outflow accelerating into the vortex core.  The other one was the accelerated inflow from the environmental air ahead of the storm.

The strength of the tornado as observed by radar was taken by simply adding the absolute magnitudes of the individual range gates containing the maximum and minimum velocity as long as it appeared meteorologically reasonable. I chose the gates on either side of what is called a Tornado Vortex Signature (TVS) if the vortex diameter was smaller than a few beam widths.  Since the radar sampled the storm in super-resolution mode, the effective beam width (~1.1 deg) is wider than the individual azimuth spacing (0.5 deg) so a TVS could still have peak velocities a couple azimuths apart.

For the West Liberty, KY storm, that value was a velocity difference (Delta-V) of 188 kts.  The distance from the Jackson, KY radar to the storm was roughly 20 nm. That's an impressive value reflecting the impressive nature of the tornado.

Let's see how it compares with other big ones.  Before I go on, note that each panel of Figure 1 is 21 nm wide, and the imagery is courtesy of GR2analyst.
Figure 1.  The supercell west of West Liberty, KY as the tornado reached maturity on 2012 March 02, 2243 UTC.  The 0.5 deg reflectivity is in the upper left, 0.5 degree storm-relative velocity in the upper right, 0.5 deg azimuthal shear in the lower right (called NROT), and the volume-based maximum expected hail size is in the lower left.

The Tuscaloosa, AL tornado from the super tornado outbreak of April 27, 2011, was one of the bigger events of that day.  Through Tuscaloosa, it produced a lot of EF3, some EF4 damage, and one area where it reached in the upper echelons of EF4.  That's the time that the radar from KBMX sampled the storm shown in figure 2.   At 2215 UTC, the tornado was reaching near maximum intensity and was relatively wide too.  The reflectivity shows an intense debris ball, a dismal reminder of the destruction wrought on the city of Tuscaloosa.  The velocity appearance  was quite similar to that of the Kentucky storm in that it showed a channel of strong accelerating flow emanating from the forward flank precipitation core into the vortex core.  The delta-V of this TVS was 199 kts.  Honestly I didn't check later on in the tornado's life to look for higher values when the storm approached Concord, AL or the north Birmingham suburbs.  Perhaps there was a higher delta-V there.  When I sampled it, the tornado was 38 nm from KBMX at 2215 UTC.  So at a farther range, the Tuscaloosa tornado was stronger than the Kentucky storm.  The precipitation shield of the supercell was also bigger but the estimated hail size was smaller than for the West Liberty storm at the time of the respective images.

Let's go on and look at other big tornadoes.
Figure 2.  Like figure 1 except for the Tuscaloosa, AL tornado of 2011-04-27 2215 UTC sampled by KBMX. 

Last year in 2011 was filled with big tornado days.  Perhaps one of the biggest tornadoes of 2011 occurred on May 24 where it started west of El Reno and continued northeast well past Piedmont, OK.  It was on the ground for almost two hours which was a little longer than the Tuscaloosa tornado but not as long as the Hackleburg to Madison, AL tornado on April 27.  The most intense phase of this tornado started south of I-40 west of El Reno where a mobile research radar (RaxPol operated by Howie Bluestein and Jeff Snyder) observed winds in excess of 120 m/s.  That radar observed EF5 winds as the tornado crossed I-40 and approached where I was watching, along with four REU (Research Experiences for Undergraduates) students.  None of the REU students have seen anything like it, even though it was partially rain obscured.  The tornado at this time was a wedge and it struck an oil well drilling platform.  Despite its weight of over 1 million pounds, the tornado had no trouble catapulting it outside the property boundaries of the site.  The tornado narrowed passing north of El Reno, and then seemed to become swallowed into a new mesocyclone.  It was quite likely the new mesocyclone vortex core produced a separate tornado north of this tornado and then both vortices merged to help create a new wedge tornado east of El Reno.

This was the time that I sampled the delta-V in the TVS below in figure 3.  The value reached 198 kts, similar in strength to Tuscaloosa.  The damage from here to north of Piedmont reached similar intensity to the earlier strong phase west of El Reno.  There was more intense damage on the ground than with Tuscaloosa.  But like Tuscaloosa, the radar depicted what appeared to be strong inflow from the main precipitation core of the supercell and a separate pre-storm ground-relative inflow reaching 50 kts.

Speaking of the precipitation core, it was huge.  By far, it was the largest of any supercell core for any of the cases I show here.  Likewise, the circulation and tornado appeared larger and stronger than the Kentucky storm, and even the Tuscaloosa tornado.
Figure 3.  Like figure 1 except for the El Reno to Piedmont tornado of 2011-05-24 2140 UTC sampled by KTLX.

Just two days before El Reno, was the Joplin, MO tornado, a massive tornado that unfortunately struck a small city of around 40 thousand people.  The results, as we know, were devastating.  No one believed that we would see another 100 person fatality producing tornado since none occurred since Flint, MI in 1957.  After all, the NWS and partners had modernized the integrated warning system.  But then again, perhaps we haven't seen a violent wedge producing tornado of this size strike such a densely populated region.

Did this tornado set the benchmark for intensity?  Like the El Reno tornado, it was rated EF5 and EF3 like damage occurred over a wide swath.  I sampled the tornado at its peak intensity and got a delta-V of 210 kts as seen in figure 4.  The size of the circulation appeared as large as the El Reno tornado but in this case, the radar was 58 nm away as opposed to 38 nm for El Reno.  This storm's appearance on radar reflects in every way the size of the tornado on the ground, similar in width to the El Reno tornado when it crossed I-40.  However, note that the size of the precipitation core was not as large as that in El Reno.  Also, this tornado quickly weakened after crossing south of I-44 and had a track of only 12 to 15 miles.  Even though it was moving slowly, the tornado didn't last nearly as long as El Reno or Tuscaloosa (only 38 minutes).  So perhaps the time integrated kinetic energy expenditure was not as large as the previous two tornadoes.  Even the Kentucky tornado likely lasted longer.  But at peak intensity, it ranked right near the top, unfortunately expending its energy into destroying a wide swath of Joplin.
Figure 4.  Like figure 1 except for the Joplin tornado of 2011-05-24 2140 UTC sampled by KTLX.
Joplin was big enough so that the tornado didn't wipe the city off the map.  On the other hand, Greensburg, KS was smaller and just about wiped off the map when it was unfortunately afflicted by a tornado of similar size to Joplin.  The Greensburg tornado was absolutely huge!  It laid down a path similarly wide to Joplin, and perhaps a bit wider when it was south of town.  But this tornado lasted well over an hour as it slowly moved to the north at about 15 mph.  I remember how much time I had to watch this monster while closing in on it from the south, every lightning flash illuminating the huge wedge.

As it reached maturity south of Greensburg, I sampled the delta-V at 223 kts at a range of about 38 nm from the KDDC radar (figure 5).  This storm was also sampled when the radar didn't have super-resolution capability.  Considering that handicap, I find the Greensburg delta-V to be the most impressive of the tornadoes I mentioned so far.  Considering that it maintained this strength for more than 50 minutes, the kinetic energy expended by this storm was huge.  The parent supercell went on to produce an even wider tornado after the Greensburg tornado died, and in fact it produced wedges for another 4 hours.  I wouldn't be surprised to see this storm take top spot in total kinetic energy expended if anyone would be up to the task to verify.

Interestingly enough, the supercell precipitation core was smaller than Joplin, El Reno and Tuscaloosa.  It was not much larger than the Kentucky storm at the time I sampled them here.  

There's one more storm to check.
Figure 5.  Like figure 1 except for the Greensburg, KS tornado of 2007-05-05 0229 UTC sampled by KDDC.
I can't leave out Bridge Creek, OK from 1999 May 03.  That day was Oklahoma's tornado outbreak for which all others in the state are compared.  The signature supercell storm of the outbreak was called storm A, and the radar image below was taken when it spawned the biggest, most damaging tornado  of the outbreak.  At the time I sampled it in figure 6, the tornado was at its nastiest and biggest.  The tornado was also on the ground for more than an hour and it also experienced a resurgence in life like that of El Reno.  

I sampled a delta-V of only 147 kts!  That was the most surprising finding, especially considering that the tornado was only about 20 nm from KTLX.  How could that be such a low value?  I'm not sure I have an answer, especially considering that this storm produced the most intense damage of any tornado that I surveyed or seen including the El Reno EF5, the Hackleburg, AL EF5.  It produced damage intensity that even likely exceeded that of Joplin.  The Greensburg tornado barely produced observable EF5 damage though it spent its most intense phase over fields south of town.  Perhaps the delta-V was weighed down by the intense, large debris that was traveling more slowly than the actual winds.  KTLX was also sampling the storm with the legacy resolution and if it had super-resolution data, it would've seen higher winds like with the Kentucky storm.  After all, intense though it was, the tornado was not as wide as Greensburg, Joplin, or even Tuscaloosa.  I guess it goes to show intensity observed at ground is not perfectly correlated with radar-observed intensity.
Figure 6.  Like figure 1 except for the El Reno to Piedmont tornado of 2011-05-24 2140 UTC sampled by KTLX.
This comparison shows that there were certainly bigger tornadoes than the one that struck West Liberty, Kentucky.  I'm also confident that the Greensburg tornado still reigns supreme out of this list, however Joplin comes in close.  However, the West Liberty tornado is amazingly powerful considering that today's storm occurred in a place not known for big tornadoes, and in the foothills of the Appalachians.
The only comparison I have occurred before the WSR-88D network and that was the central Pennsylvania tornado that occurred during the 1985 May 31 outbreak.

I hope you enjoyed this tour of some big tornadoes.  Like I said, there are many candidate monster tornadoes that I didn't sample.  Hacklesburg, AL comes to mind as one I didn't include.  But there are many plains monsters for which nobody will know about except the chasers fortunate enough to witness them.  Any one of those is a candidate for this hall of fame of tornadoes.