At 500 mb, this cold wave is manifesting itself with very low geopotential heights across the western Lakes. Any time I see heights falling below 500 dm as far south as Lake Michigan, I'm looking at an unusually deep midlevel trough. Now the media has spread the term 'Polar Vortex' like wildfire as if it's something right out of the movie 'Day After Tomorrow'. Hopefully there's no panic ensuing should the mythical 'eye' of the vortex passes overhead. Again the only unusual aspect of this 'Polar Vortex' is that a lobe of it extends pretty far to the south. But as with so many times this happened before, we'll survive.

Perhaps more impressive is that the 850 mb temperatures have fallen to -30 C over the upper midwest and as I wrote in the last entry, these sub -30 C temps will advect eastward to Pennsylvania. Again, as far as the big cold waves are concerned, this is not unprecedented, only unusual to the extent that they occur every several years or so.


To see what I mean by unique, I go back to basics of snow crystal formation. Crystal shape is highly dependent on the temperature in which it grows and the level of supersaturation that occurs (RH>100% but not by much). Here, in a typical environment of snow, the type of snow crystal is heavily dependent on temperature based on this diagram from Ukichiro Nakaya, and replicated many times since (see this review article from Libbrecht 2005). The fluffy dentrite-dominated snow preferably forms from -10 to -20 C under typical supersaturations, and can be most often observed naturally with modest ascending air associated with orographic snow in the intermountain west, some lake effect snow, and on the cold side of extratropical cyclones. It is at these temperatures that the precipitation production efficiency reaches its peak in saturated ascending air. The two consequences of this are that precipitation rates reach a maximum (all other considerations being under control), and the snow becomes less dense. Clusters of dendrites (snow flakes) reach their fluffiest potential when the -10 to -20 C layer is firmly embedded within a cloud.

That's not going to happen once the eastern lakes are firmly embedded in the coldest of the arctic airmass. According to the forecast sounding early Tuesday morning, places like Watertown, NY will exhibit a surface temperature of around -14 to -17 C and the temperature within the lake effect cloud will only be colder. When viewing Nikaya's diagram above, ice crystals forming in temperatures from -20 to -30 will yield more simple ice crystals that may find a more difficult time in joining together to create snow flakes. Or even if they do, they would likely be denser. Thus the snow will be denser. In addition, small supersaturations may yield less efficient precipitation production processes may yield smaller amounts of precipitation. What the result will be is likely less precipitation of denser snow. This super cold lake effect snow from early tomorrow morning till Wednesday should be predominantly a dense assortment of plates and columns.

But will that be the case? One thing to remember is that Nikaya's diagram is the result of crystal growth in a controlled laboratory setting, perhaps in a chamber large enough to document the crystal growth but certainly not too large to control all the parameters researchers desired to change. How similar will such a setting be compared to a band with a meso-alpha structure similar to that depicted in the forecast below for 0600 EST Tuesday morning? According to the 4 km NAM (courtesy of NWS BTV), there will be an intense long axis lake effect band with a band-induced convergence zone and a mesoscale inflow jet exceeding 40 kts on its south side.

The NAM is also quite aggressive in modifying the low-level temperature field due to strong sensible heating as the band accelerated the flow across the lake. If the NAM is truly correct, then 2m temperatures will stay in the 20's F over the lake which is the reason that substantial amounts of CAPE will exist to aid convection. Nakaya didn't create the chart in moist convective clouds.


Thus if the NAM is correct, then there will be a substantial opportunity to get saturated ascent within the -10 to -20 C layer and that ascent will be strong starting from very shallow layer near the lake. Will this scenario be the case? The only way to find out is to sample the very low levels over the lake, or immediately along the shoreline near or in the band. If we don't see temperatures near 20 F in the band on the shoreline tomorrow morning then the NAM is off the mark and we'd have to find out why.
What if the NAM temperatures wind up being too high? Would the lake effect be just high density plates and columns of snow falling at a less than optimal rate? Should the forecasts tone down their snowfall amounts to lower values than the nearly incredible 6" of liquid equivalent forecast by the 4 km NAM over the Tug Hill? Let's go back and find out from the two previous cases of super cold arctic air that I mentioned earlier.
Back in 1994, a similarly cold arctic outbreak took a similar trajectory around a strong surface low in northern Ontario with a similar pattern. The 500 mb 'Polar Vortex', if you will, took a similar southerly track, the 1000-500 mb thickness was below 500 dm and, if anything, the 850 mb temps were even colder. At the time I worked in Washington DC and Lake Ontario was just a short 7 hour trip up on Rt 81. I had to go experience this epic event and I asked my friend Bob Boyd if he wanted to go. He was interested too. We departed a couple days before the main event was to begin on the 18th with Oswego as our target.

 |
| A view of Lake Ontario on Jan 18, 1994 from near Nine Mile Point facing north. Thick lake effect snow darkened the sky as a long axis lake effect band developed. Closer to me, a hole formed in the shore fast ice creating a natural blow hole as waves swept into the narrow constriction. |
The sounding from Buffalo that evening was impressive. It showed that the convective layer could easily have been up to nearly 4 km with lake heating, but starting out with a surface temperature near -20 C! There was no part of the sounding within the dendrite layer. Thus the snow that we were getting would likely have formed in temperatures well below the optimal levels to maximize precipitation efficiency. Yet we were getting absolutely clobbered.

When morning broke, the scene outside our hotel room looked like the picture below. It was tough to make a good guess of the snowfall overnight but I suspect over 2 feet and less than 3. What was more interesting though was that every upwind surface was plastered with snow. This was a scene that I would've expected from a wet snow. But clearly when the surface temperature was near 0 F, there wouldn't be much liquid water to provide the adhesive properties of this snow.
 |
| A view looking east in the morning of Jan 19, 1994 in Oswego, NY after a major super cold lake effect event. |
 |
| Icicles hanging off the east side of the hotel were covered in snow while a parking sign in a nearby Walmart wore a nearly perfect pyramid of snow on its upwind side. |
 |
| Snow stuck to trees and power lines throughout the city after the main lake effect snow event. |
At near 0 F, I would've expected an easier time of it removing snow from cars. Not in this case. The snow stuck more like melted marshmallow.
 |
| My car was frosted by snow from the cold lake effect storm in Oswego, NY. |
The adhesive quality of the snow was different than any other kind of snow for which I experienced and the first hypothesis I had for this type of snow was that it was statically charged in the strong electric fields present in the snow band. Considering the amount of lightning we had overnight, this is the best explanation I had for the nature of the snow.
Nearly 9 years previous to the 1994 event, I was fortunate to experience another impressive shot of extremely cold lake effect on Jan 20, 1985. This one was colder than anything today could dish out and the 1994 event. The 500 mb plot showed a much more exceptional low latitude 'polar vortex' than today's or in 1994.
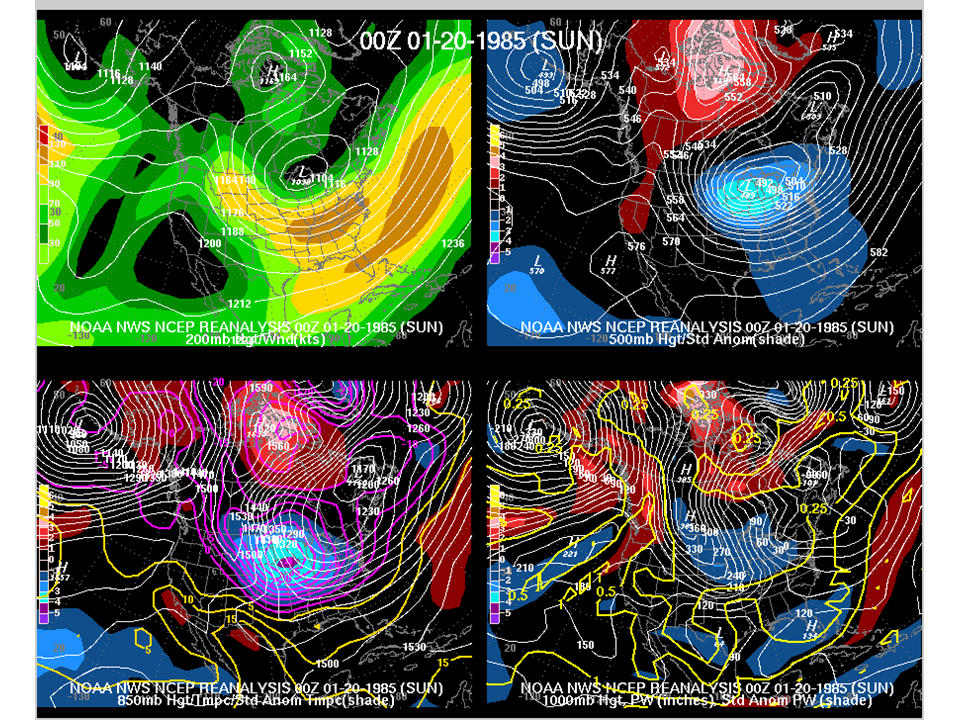
Again the Buffalo sounding showed exceptionally cold air starting out nearly -20 C with no sign of a dendrite production layer.

As in the 1994 event the snow band struck Oswego with a severe dumping with near surface temperatures close in the low single digits F. The picture below was taken near the height of the lake effect event when we were in the strong inflow south of the band axis. My friend, Anthony Artusa was surely reveling in this as much as I was. Later on, we experienced several nearby strikes of cloud to ground lightning and several prominent towers in the area exhibited significant coronal discharge.
 |
| Oswego getting pounded by lake effect on Jan 20, 1985. |
 |
| A picture of me enjoying the aftermath of the lake effect on the SUNY Oswego campus on Jan 21, 1985. |
In both cases, I believe the snow was statically charged in a highly electrified environment within the lake effect band. Assuming that was really the case, a strong electrical field plays havoc with Nakaya's snow growth chart. Libbrecht (2005) describes that strong electrical fields can accelerate growth of crystals, typically with strongly accelerated growth of needles under a modest application of an electric field but then significant branching may occur at higher field intensities. The enhanced growth rates could easily compensate for the slower growth rate of snow crystals at temperatures outside the dendrite production zone of -10 to -20 C.
Whether or not this idea of electric field-induced crystal growth explained the huge snowfall rates is not something I can prove. For one thing, I would've had to test whether individual snow flakes had a charge. Second, there's not much understood about snow growth in electric fields, as this article in snowcrystals.com website explained. Clearly though, the presence of electric fields means that one who uses the Nakara crystal habit diagram to forecast snowfall rates, or snow density in lake effect events, stands the possibility of being wrong.
In addition to the uncertainties with electric field induced growth, much of the snowflakes I saw during both past events were heavily rimed. Many times I witnessed the classic dumps of graupel. This was not partially melted graupel, obviously, but snow flakes were so rimed that they took on the rounded shapes of graupel, and there were huge amounts of them. In fact, this may have explained why Oswego only got a 17:1 snow to liquid ratio out of the 1994 event. So this does bring back the idea that liquid water content also played a significant role in determining the snow type in Oswego. If the lake effect clouds were truly at or below -20 C, I can't imagine too much liquid water within them. Yes there may be some, and perhaps enough to cause significant riming. However much of the riming I saw seemed to have come from warmer temperatures. I suspect there was strong saturated ascent at temperatures warmer than what we saw onshore in Oswego. But there was no way of knowing. However, if the near surface temperatures depicted in the 4km NAM forecasters was anywhere close to being true then I can imagine not only an active dendrite production zone but also significant riming. Certainly the strong buoyancy concentrated close to the lake surface, in combination with saturation, would yield enough flux of liquid water to do the job.
One has to also question how in the world did I experience lightning in both cold events if the cloud was too cold for significant charge separation via the interaction of graupel and lighter crystals? Both of these events would've seriously fallen off the left side of the range of a nomogram proposed by Steiger et al. 2009 namely because the height of the -10 C level was below ground. They used the -10 C level as one of the important parameters determining the likelihood of lake effect lightning as a proxy for the presence of mixed graupel and snow crystals considered necessary for charge separation. Their other most significant parameter, convective layer depth, was considered an important contributor to updraft strength. The one consideration that could not easily be put into the parameter was the lake band morphology. Just about all lightning events came out of long axis single lake effect bands. This was not a worry for either of the events I experienced. But the extreme cold temperatures suggest that the only area with significant graupel production would have to be relatively close to the lake. And that any loss in graupel production efficiency owing to the cold would have to be made up by intense vertical motions right off the lake surface. I suspect the extreme horizontal and vertical temperature gradients could have supplied the necessary vertical motion. Again, if somehow, the NAM is right about the over lake 2m temperatures for this event, then these past events would have had similarly warm over lake temperatures. I remain doubtful of that the NAM is right.
 |
| A nomogram showing the occurrence of lightning (stars) vs its nonoccurence (dots) as a function of the -10 C isotherm height and lake induced equilibrium level based on lake induced CAPE. This is figure 10 in Steiger et al. (2009) |
What does this have to do with this event? Well, the OWLES project gives an opportunity to answer whether or not there is significant charge splitting from graupel formation in an extremely cold event. The project can also determine if the NAM is correct in its 2m over lake temperature forecasts and whether that is a significant contributor to vertical velocities. After all, we need to figure out how strong these vertical velocities can become with such extreme thermal gradients. And we need more documentation of lightning under extremely cold events. It's not often that a field project can coincide with a once in 10 year event like this. Good luck!
p.s. I heard from Dave Zaff, the SOO in Buffalo, that there was lightning this evening with the Lake Erie snow band. The 00Z sounding's maximum temperature was -13 C and a convective layer depth was around 2.7 km. So it has begun.
References:
Libbrecht, K. G., 2005: The physics of snow crystals, Rep. Prog. Phys, 68, 855-895. Available online at [http://www.its.caltech.edu/~atomic/publist/rpp5_4_R03.pdf]
Steiger, Scott M., Robert Hamilton, Jason Keeler, Richard E. Orville, 2009: Lake-Effect Thunderstorms in the Lower Great Lakes. J. Appl. Meteor. Climatol., 48, 889–902.
Steiger, Scott M., Robert Hamilton, Jason Keeler, Richard E. Orville, 2009: Lake-Effect Thunderstorms in the Lower Great Lakes. J. Appl. Meteor. Climatol., 48, 889–902.


